By Jeremy C. Reed reed@
This article introduces gcov, the GCC coverage testing tool, and LCOV, a nice front-end for collecting coverage data and creating navigatable HTML page reports. Note this is GCC specific.
These tools may be used to help someone new to some source code to better understand it, help the developer by identifying places in the code that could be optimized, and help the quality assurance of the code by showing the parts of the code that aren't exercised by tests. In particular, tests often are written to show that common or normal usage of the program works as intended, while a coverage report may show that tests are also needed for input errors, corner cases, or extreme settings. The reporting is also useful to verify that good test-driven development (TDD) is followed.
The gcov tool provides useful outputs, but quickly correlating a lot of its provided details is difficult and time-consuming. The LCOV suite makes is easier and quicker to analyze and understand the coverage data.
The gcov tool (and library) are commonly included with the main GCC package (such as the Red Hat gcc RPM or the Debian gcc package). On some systems, the library may also be provided in a separate library or development package for gcc.)
The gcov statistics are based on line-by-line recordings of when lines of source code are executed. You may want to consider using inline functions instead of multi-line macros, but it may still have expected results. Also so the results are useful, follow a programming style that only has one statement per line.
You may also want to compile without optimization to make sure that compiler improvements don't hide places you may want to better optimize. (For example, you may need to turn off the gcc -O optimizations.)
To generate the gcov data, compile your program with two GCC options: -fprofile-arcs -ftest-coverage.
The -fprofile-arcs gcc switch tells the compiler to add code so the program will keep track of how many times lines of code or code blocks are executed. As the running program exits, it will save this record to a file with extension ".gcda" corresponding for each source file. These outputs are saved in the same locations as the corresponding object files. Note that the .gcda files are not overwritten, but updated with the new execution counts, on multiple or concurrent runs.
The -ftest-coverage gcc switch is used to create notes files that gcov uses to show the program coverage. These files are created at compile time with the file extension of ".gcno".
(You may use your other compiler flags as desired, but note again, that some optimizations may skew the line-by-line coverage reports.)
The instrumentation code is provided in the libgcov library, commonly included with GCC. So use the gcc switch -lgcov to tell the linker to combine with it.
A short-cut for these three switches is the GCC --coverage switch. For common autoconf/automake based builds, you may use the following to prepend the switch to the additional compiler flags:
./configure CFLAGS="--coverage"
Then build the program with "make". In some build environments you may need to modify the Makefile or build specification to introduce the compiler switch (and to optionally turn off compiler optimizations).
When the program is ran, either manually or part of a test suite, the corresponding .gcda file or multiple files are created -- one for the main executable and for the separate object files it was made from. Note that you can run the program in an installed location (and doesn't have to be in the build tree) and it will still know where to put its .gcda files with the original object files.
Run gcov in the directory containing the .gcno and .gcda files. Its main argument is the name of the source code file to show the analysis for. If the object file has a different name, then for the argument use the base name without the ".o" or ".gcda" suffix.
When running the gcov tool to see the summary, it also creates the corresponding .gcov output file. (If you don't want the file created, use the --no-output gcov switch.)
The "branch" term for gcov indicates that the code has different code paths it make take; for example, when using the if or switch/case constructs, while or for loops, or using a function.
The "call" term corresponds with functions to indicate if they were used and returned from, or if they were never executed.
Two useful gcov switches are:
--function-summaries displays the names of each function and the percentage of the lines executed in that function.
--branch-probabilities shows the branches executed percentages including what was taken at least once and the calls executed. This will add these details to the .gcov output and provide a summary to the console.
Combine those two gcov switches to see the further information per function.
The .gcov output file is human-readable with each line containing this format:
number of executions for the line : the line number : the code from that line
If no code exists in that line (like it is blank or a comment only), the number of executions will be represented with a dash (-). If the line was never ran, then it will have a "#####" (four hash marks). (Line number 0 is used for a preamble for gcov.)
When using the --branch-probabilities switch, the additional lines starting with "branch", "call", or "function" indicate if it was executed or not, for example.
Using the single-file gcov textual output does not scale well for huge projects (such as those with thousands of source files). Third-party tools are available to better manage or visualize the results, including gcovr and ggcov. For this article, we will explore using LCOV.
LCOV, originally released in 2002, was developed and is maintained by the Linux Test Project. The LCOV webpage and official downloads are at http://ltp.sourceforge.net/coverage/lcov.php
The common packaging systems also include a "lcov" package, so install it using yum or apt-get or your favorite installer. It depends on Perl and provides five executables and corresponding manual pages.
Many popular projects such as PHP, Mozilla Firefox, elfutils, Samba, and WINE have used LCOV to analyze and improve their testing. Some projects provide make targets or build configurations to build with the gcov support and to generate coverage reports. For example, ISC Kea (DHCP servers) and the popular GNU Coreutils (which provides many fundamental Unix tools) provide make targets to generate test coverage reports. But for this article, we will use command-line examples directly using the LCOV suite.
The four main steps are:
1) build the source code using GCC with the special --coverage compiler options;
2) run the executable or run the tests (such as with "make check");
3) use the lcov tool to analyze the gcov outputs for the programs just ran and saving the details to a LCOV trace file; and
4) use the genhtml tool to create the report webpages using the source code and trace file.
For example (with console outputs not provided here):
    $ ./configure CFLAGS="--coverage"


    $ make


    $ make check


    $ lcov --capture --directory . --output-file coverage.info
After building the code with the gcov instrumentation and running the results (in this case by using the tests), the lcov step tells it to process the gcov data files in the current directory (.) and subdirectories (by default) to generate its LCOV trace file. (Note that the output file uses the extension ".info" by LCOV convention; be sure to don't overwrite documentation in the Info format by using the same name.) Depending on the size of the project, this may have hundreds of lines of console output as it processes the files.
$ genhtml --output-directory coverage-html --legend coverage.info
This genhtml step creates a directory containing a few images (used to create the bar graphs) and a CSS stylesheet, and generates the various HTML webpages for the overview pages and for each source code file referenced by the named trace file. The --legend switch simply provides the color (and branching symbol) explanations on the webpages. At the end of the many lines of console output, genhtml will also display a summary of the overall coverage rates.
Then use a web browser to review the results starting on the top summary page:
$ firefox coverage-html/index.html
It is also usable via a console browser like elinks or lynx.
Note that the lcov --directory switch is important. LCOV was initially designed for investigating kernel code, so to change the default to evaluate your userspace code, use that switch to point to where your local gcov .gcda data files are. In addition, you may need the --base-directory switch to specify the directory when the source code is in a different location than the object files.
Figure 1 is an example LCOV-generated code coverage report. It represents the coverage of the src/ directory in GNU Coreutils 8.25 after running its many tests. The legend explains the colors for the overview: red for poor coverage, yellow for acceptable or okay coverage, and green for good coverage. The top right gives total counts for the number of lines and functions (and optionally, branches). The hit column indicates how many times the gcov instrumentation saw that line or function (or branch) executed.
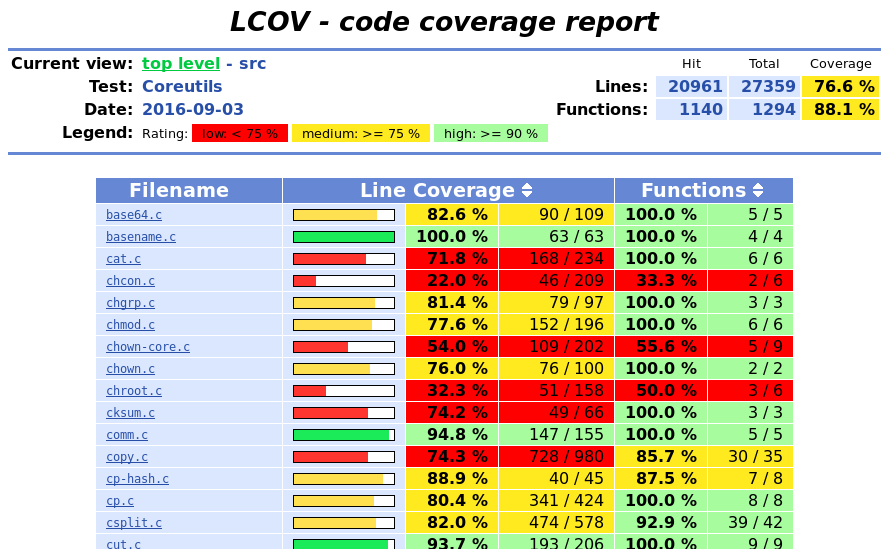
The main table, sorted by the source filenames by default, shows the hits and totals for the lines and functions (and optionally branches) per file. A simple colored bar graph makes it easy to quickly visualize the results.
Multiple webpages are created for each report overview. Clicking on the arrows after the column name will display the fields also sorted starting with the worst line or function (or branches) coverage to quickly see what needs work. (Scroll down to the bottom to see best coverage.)
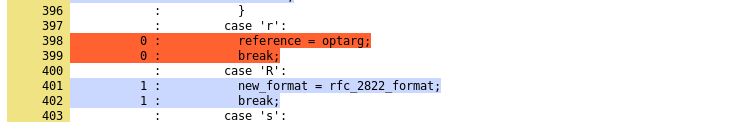
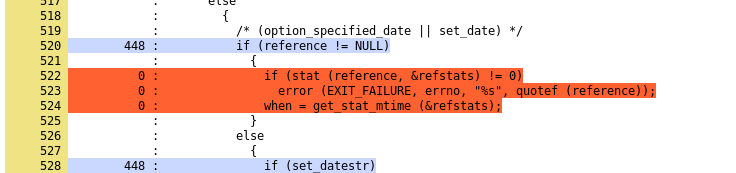
Figures 2 and 3 show part of Coreutil's date.c after running its tests. It is an example of a "date" feature that is untested (display of a file's last modification time). The blue color lines are for source code lines that are executed (or hit) and the red lines are for source code lines that weren't used (or not hit).
LCOV has many configurations to define how the report webpages are generated and look. Your customizations may be placed in your home dot-file at ~/.lcovrc or in the system-wide /etc/lcovrc (or different location depending on how your LCOV suite is installed). See the lcovrc(5) manual page for details on its many configurations. These settings may also be set on the lcov and genhtml command lines by using the --rc switch.
Depending on your installation of LCOV you may also have branching details on the generated webpages too. To make sure this is done set the lcov_branch_coverage=1 in your ~/.lcovrc dot-file or use --rc lcov_branch_coverage=1 on both your lcov and genhtml command lines.
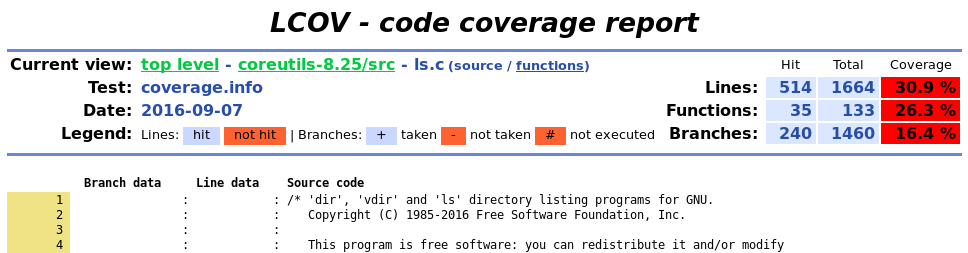
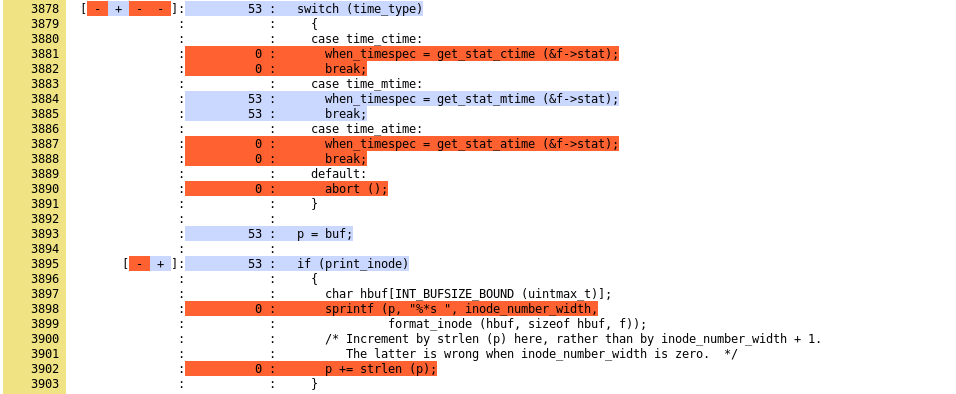
Figures 4 and 5 are for a source code report that includes the branching details. This example is for the popular ls tool when running it with its -ltr switches. (This example does not include running the coreutils tests for ls.) Notice in the top right summary that the 1664 line source code file contains 1460 branching possibilities. Branch lines in the source code view indicate if the branch is taken (+), not taken (-), or simply not executed (#). On line 3878 in the Figure 5 example, it shows the [ - + - -] branch data which indicates for that switch/case construct that only the second case statement is matched. Line 3895's branch data [ - + ] shows that the if statement's condition wasn't successful so it didn't branch into its following code.
While LCOV defaults to 90% or better has the green high coverage and 75% for the yellow medium coverage, you may have other rates that match your development goals or requirements. You may use the genhtml_hi_limit and genhtml_med_limit configurations to adjust that; for example:
   $ genhtml --output-directory coverage-html --legend \
    --rc lcov_branch_coverage=1 --rc genhtml_hi_limit=80
    --rc genhtml_med_limit=50 coverage.info
(Note that anything below that 50% medium limit is the red low rates.)
If you want to make further changes to the HTML presentation, copy the gcov.css file to a new file name and make your CSS stylesheet modifications (such as colors, font sizes and faces, table formatting, etc.). Then use the genhtml --css-file switch to point to your new stylesheet file.
If you need to generate a new report from new data, you can reset the trace files with the lcov --zerocounters switch. Use it with the "--directory ." argument to delete all the gcov .gcda data files in the current directory and its subdirectories. Note again that these files are created when the gcov-instrumented program is ran.
A common issue with using LCOV is that the gcov data doesn't match the binary. If you updated your source or rebuilt binaries, previously existing .gcno notes files or .gcda data files may not match. The lcov run may indicate the files are corrupted or are mismatched. In addition to removing the .gcda files, you may want to remove out-of-date .gcno files too.
You may want to zero counters and generate different reports for manually ran tests, unit tests, system tests, and combinations of tests so you can compare the results and to better understand your different test coverages.
Other common genhtml options include:
--title to provide a brief name or identification for the report.
--frames which creates a narrow graphic image showing an unreadable overview of the source code used as a clickable map (on the left side of the webpage) to quickly jump to some section in the corresponding source code. (For example, clicking in the middle of the overview image will take you to the middle of the source code view.)
Note you may have multiple trace files used for generating a single report. Trace files may also be combined for multiple runs or pruned of specific paths or source files you don't want included in the report. Running an instrumented program and generating a report for it may include other source code from your system or other dependencies that you are not interested in and may clutter or over-complicate your report and skew your statistics. The following is an example of removing the files in a subdirectory from the previously-created trace file and then generating the website report using the new trace file.
   $ lcov --remove coverage.info lib/selinux/\* --output report.info


   $ genhtml --output-directory coverage-html --legend report.info
(Notice the escaped \* for the pattern of the files to match to exclude.)
Again the main purposes for LCOV are to review what code was exercised by tests and to better understand the flow of the code. By running the program (not using tests) for simple scenarios, a developer can follow in the LCOV report the code path actually used to associate its basic features with the source.
LCOV provides a very valuable starting point on how to improve test quality, especially when visualizing large amounts of code. Code coverage output is useful for sharing between management, test development teams, and the code development teams. For more information about LCOV, be sure to read the manual pages.
------------------
Jeremy C. Reed has over ten years experience in software Quality Assurance for open source and proprietary software. He is a board member for The NetBSD Foundation. The author has used LCOV for over seven years on various Linux and BSD platforms in researching existing test cases and for identifying testing needs for BIND, Kea, ISC DHCP, nmsg, wdns, mtbl, and other software suites. He is currently authoring books about pfSense and the history of Berkeley Unix. His homepage is at http://reedmedia.net/~reed/ .
(This article was authored in September 2016.)